I'm excited to share my work on a web application for the International Crane Foundation that helps users find where they can see Sandhill Cranes in the wild.
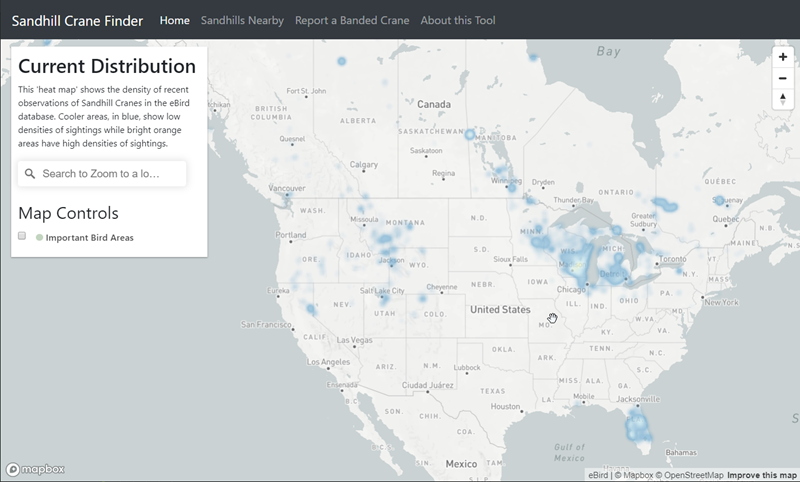
The Sandhill Crane Finder integrates data from Cornell's eBird API, National Audubon's Important Bird Areas in the United States, and the user's location to help visitor's find where they can see these inspiring birds in the wild. The Web App is built responsive first for use on mobile devices.
Tools: Mapbox GL JS, eBird Data API, PostgreSQL & PostGIS, HTML, CSS, Node JS, Python
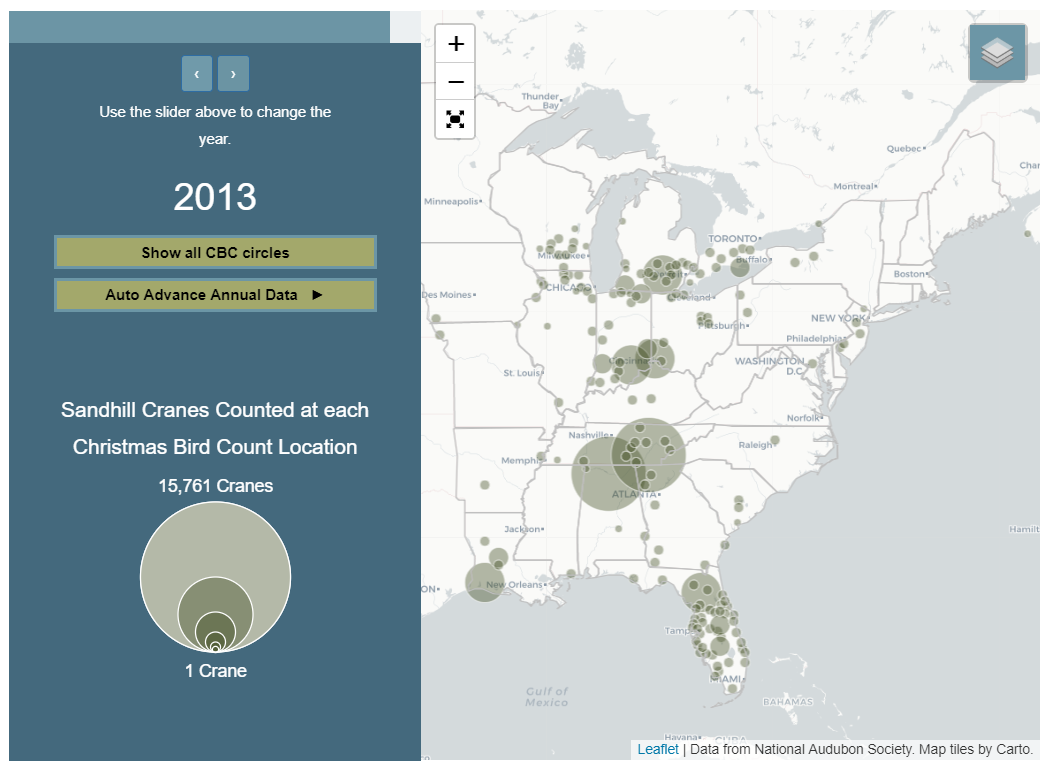
As a final project for a class in Interactive Cartography and Geovisualization at the University of Wisconsin, I worked with a couple of classmates to create an interactive blog post for the International Crane Foundation visualizing changes in Sandhill Crane distributions over 50 years. We used a mixture of Leaflet and D3 for the project.
Tools: Leaflet, D3, PostgreSQL & PostGIS, HTML, CSS
The Whooping Crane Eastern Partnership is reintroducing Whooping Cranes toe the eastern flyway of the United States. I created this simple map wo help supporters track the cranes through the year. The map performs a database call to the research database to update the map at least once per day.
Tools: PostgreSQL & PostGIS, MapBox GL JS, Node.js
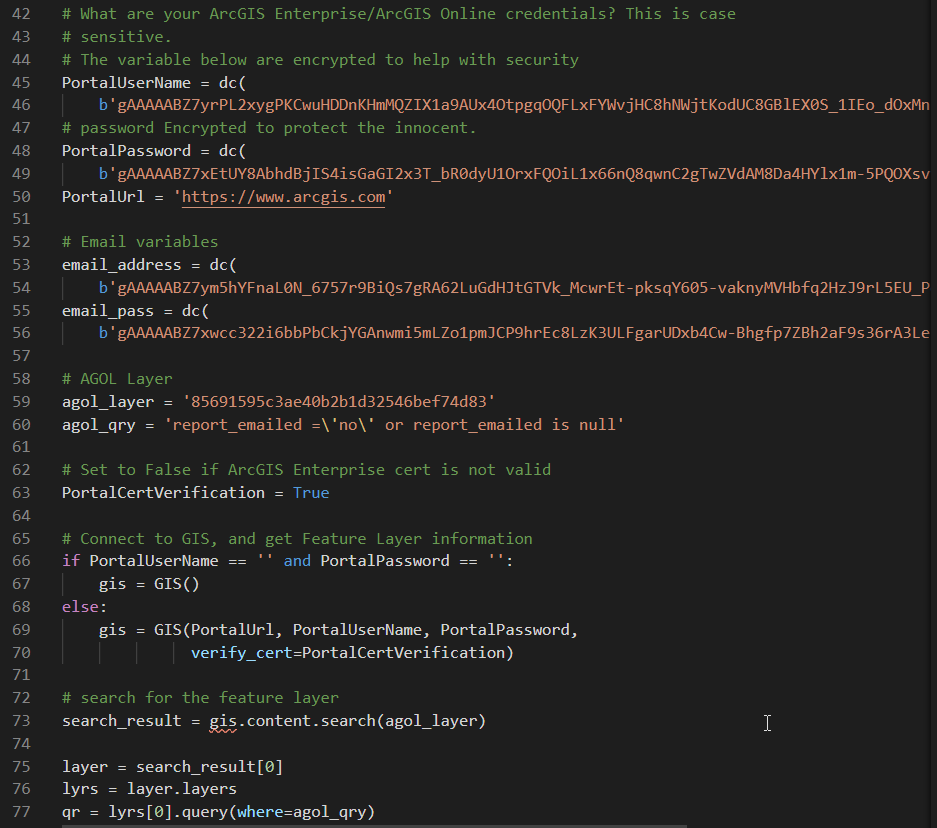
The International Crane Foundation uses web forms created with Surevy123 for ESRI to enable the public to report sightings of banded birds. I created a python script to automate the sending of resightings to our field researchers. The script uses sends a email for each reporting survey/resighting including links to locations and attaches any images uploaded by the user. thre script runs on s cheduled basis on an internal server.
Tools: Python, ArcGIS python api
The International Crane Foundation recently completed work on new range maps for the world's fifteen species of cranes for the IUCN SSC Crane Specialist Group. I helped compile the general range information from researchers around the world to create broad scale range maps.
Tools: Avenza MAPublisher, Adobe Illustrator, ArcMap
In a cartography course, we were tasked with creating a topographic map for an imagined 1000 km bicycle race. To create them map, we combined raster elevation data and vector layers combined in Adobe Illustrator and Photoshop to create the final project.
Tools: ArcMap, Adobe Illustrator, Adobe Photoshop, Avenza MAPublisher, Avenza Geographic Imager
This is for a class project only, and not for official use.
Students were asked to make a long-form infographic as part of a cartography course. I created one for using Annual Midwest Crane Count data to talk about the relationship between cranes and the landscapes where they breed.
Tools: ArcMap, Adobe Illustrator
This is for a class project only, and not for official use.
Each year the International Crane Foundation trains new field interns how to triangulate the locations of birds tagged with radio transmitters. We created a tool to help visualize the process and calculate the estimated triangulated location of the bird using the azimuth and observation points of the observer.
Tools: Python, ESRI arcpy
This map of the Zambezi River Basin is an example of a series of maps created to support a fundraising campaign for the International Crane Foundation's conservation work. The maps shared a similar style to create a consistent look for the campaign.
Tools: ArcMap, Adobe Illustrator, Avenza MAPublisher
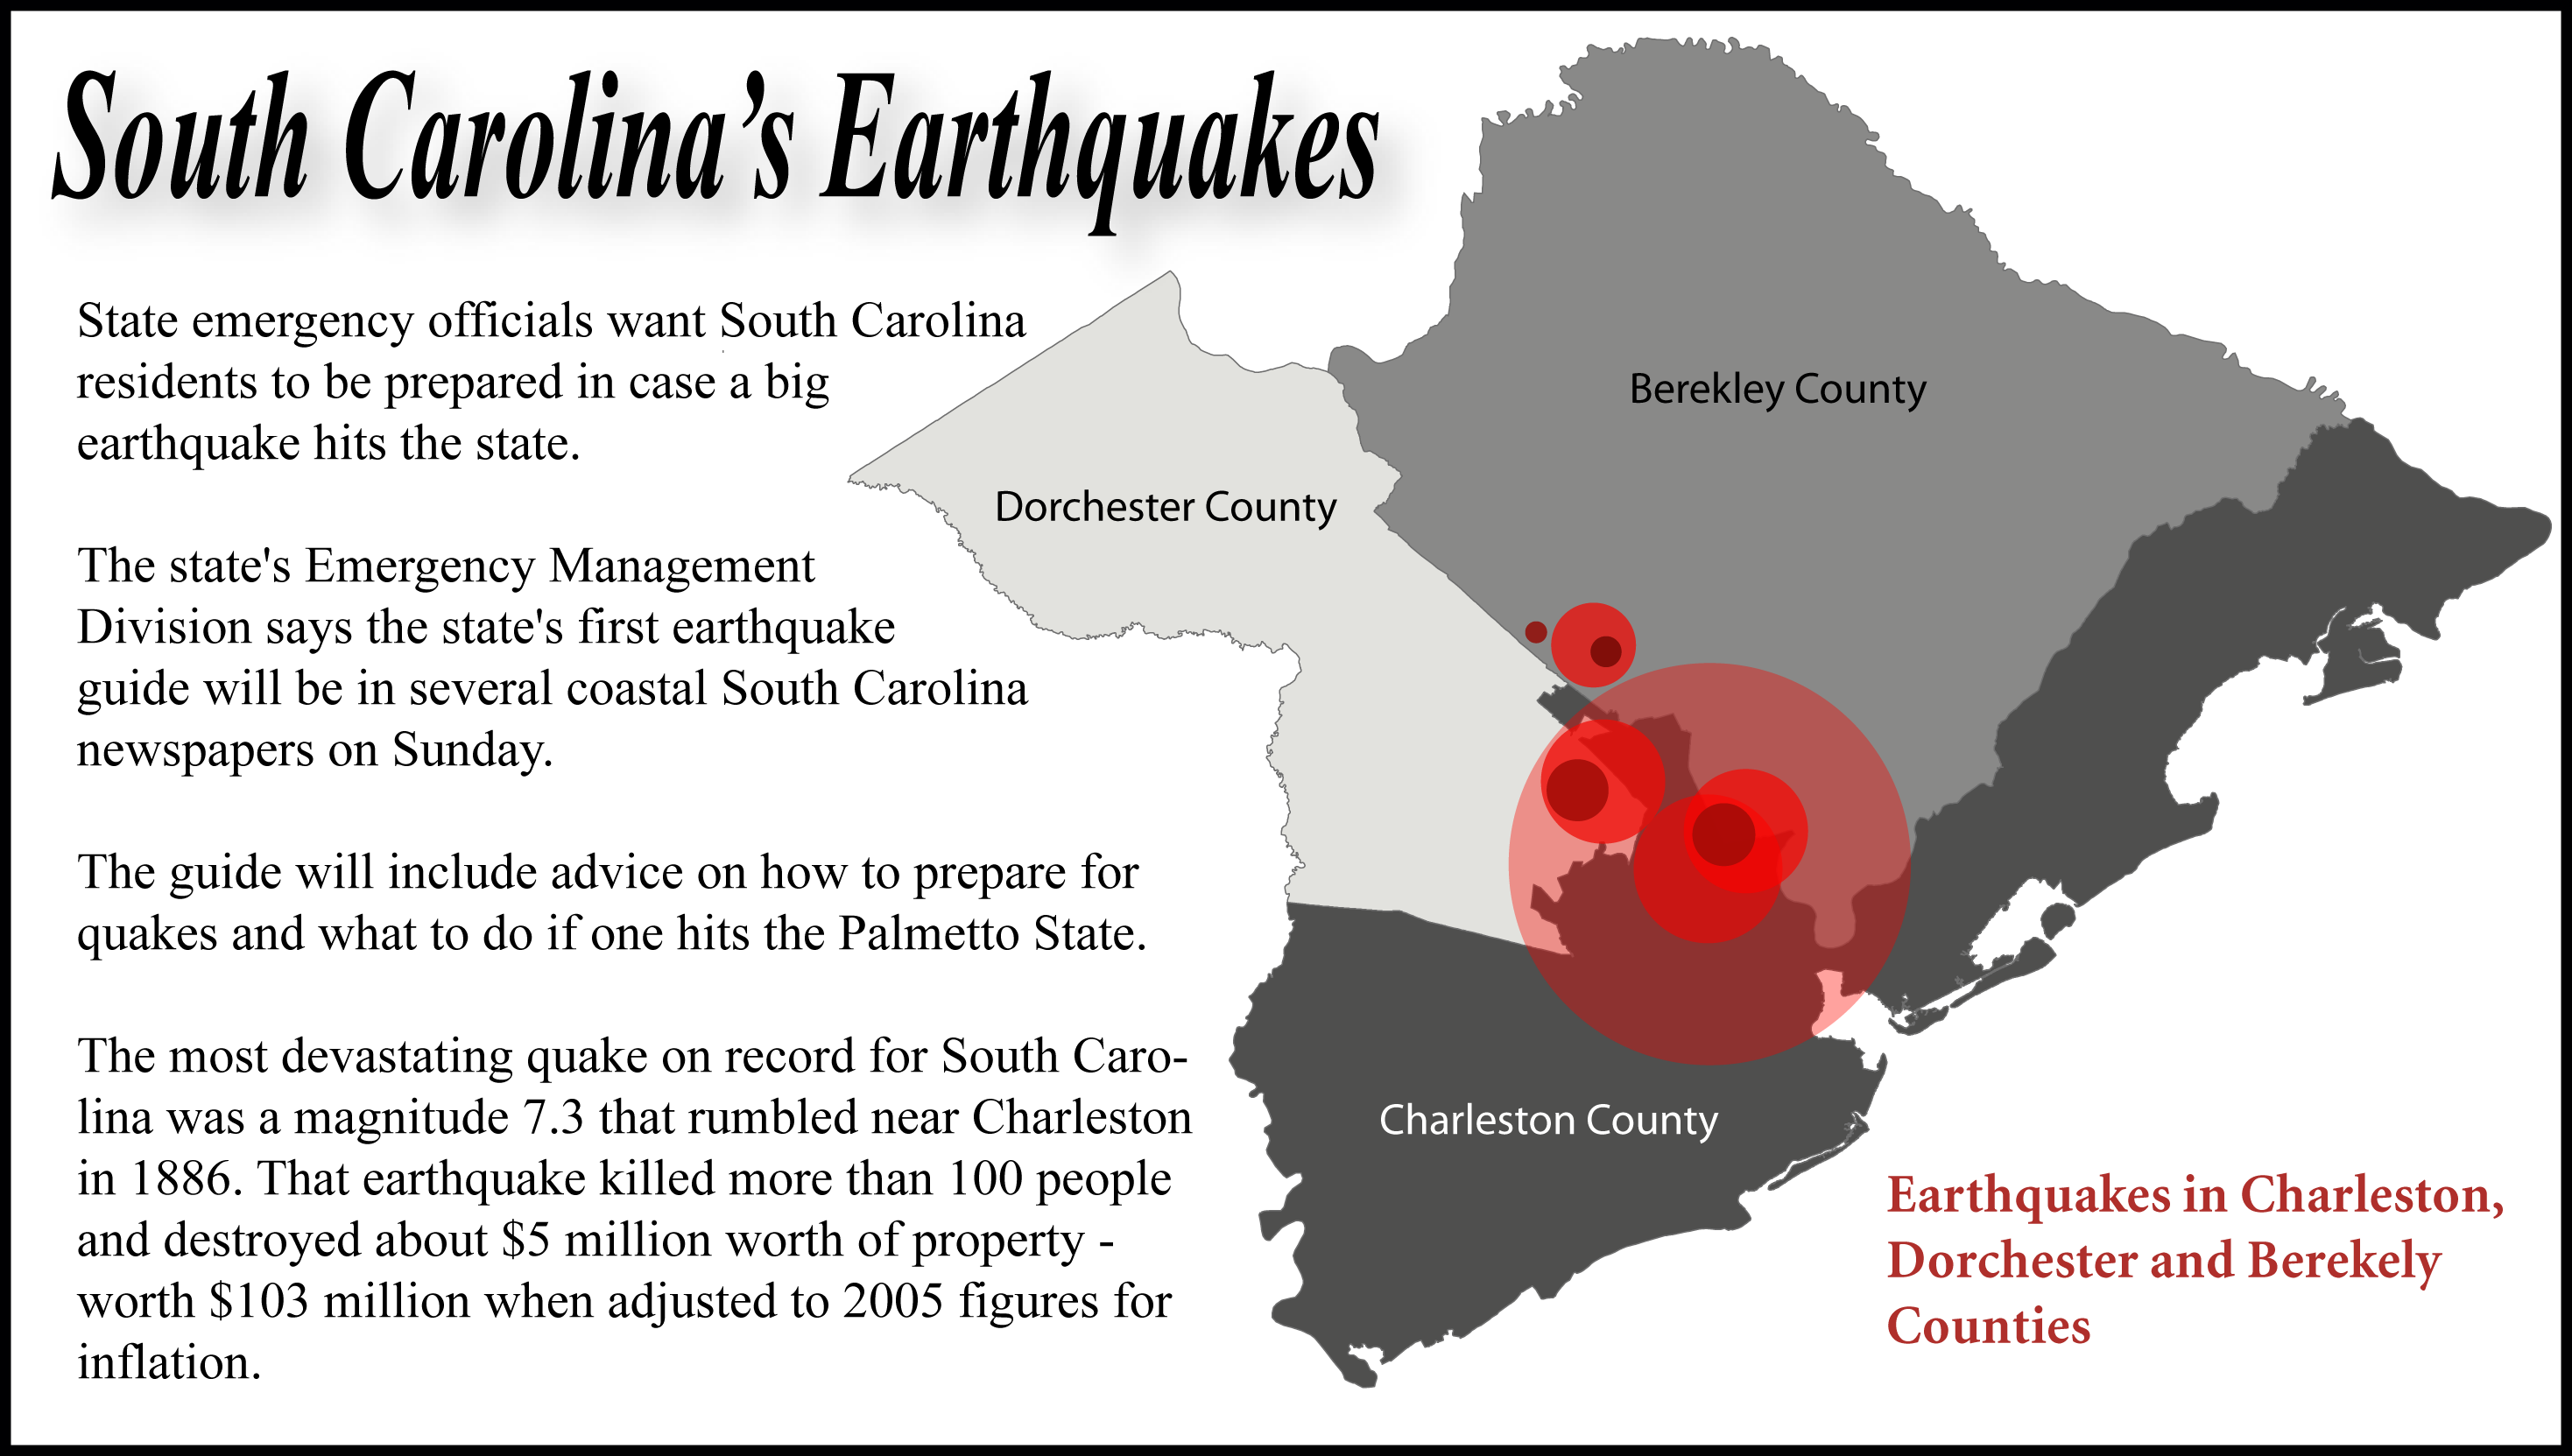
Example of a simple graphic using greyscale features and strong color to highlight earthquakes in South Carolina. The goal of the map was to create a sense of urgency and focus the reader's attention. The map was used as a banner for web viewers to click on a site for more information.
Tools: ArcMap, Adobe Illustrator, Avenza MAPublisher
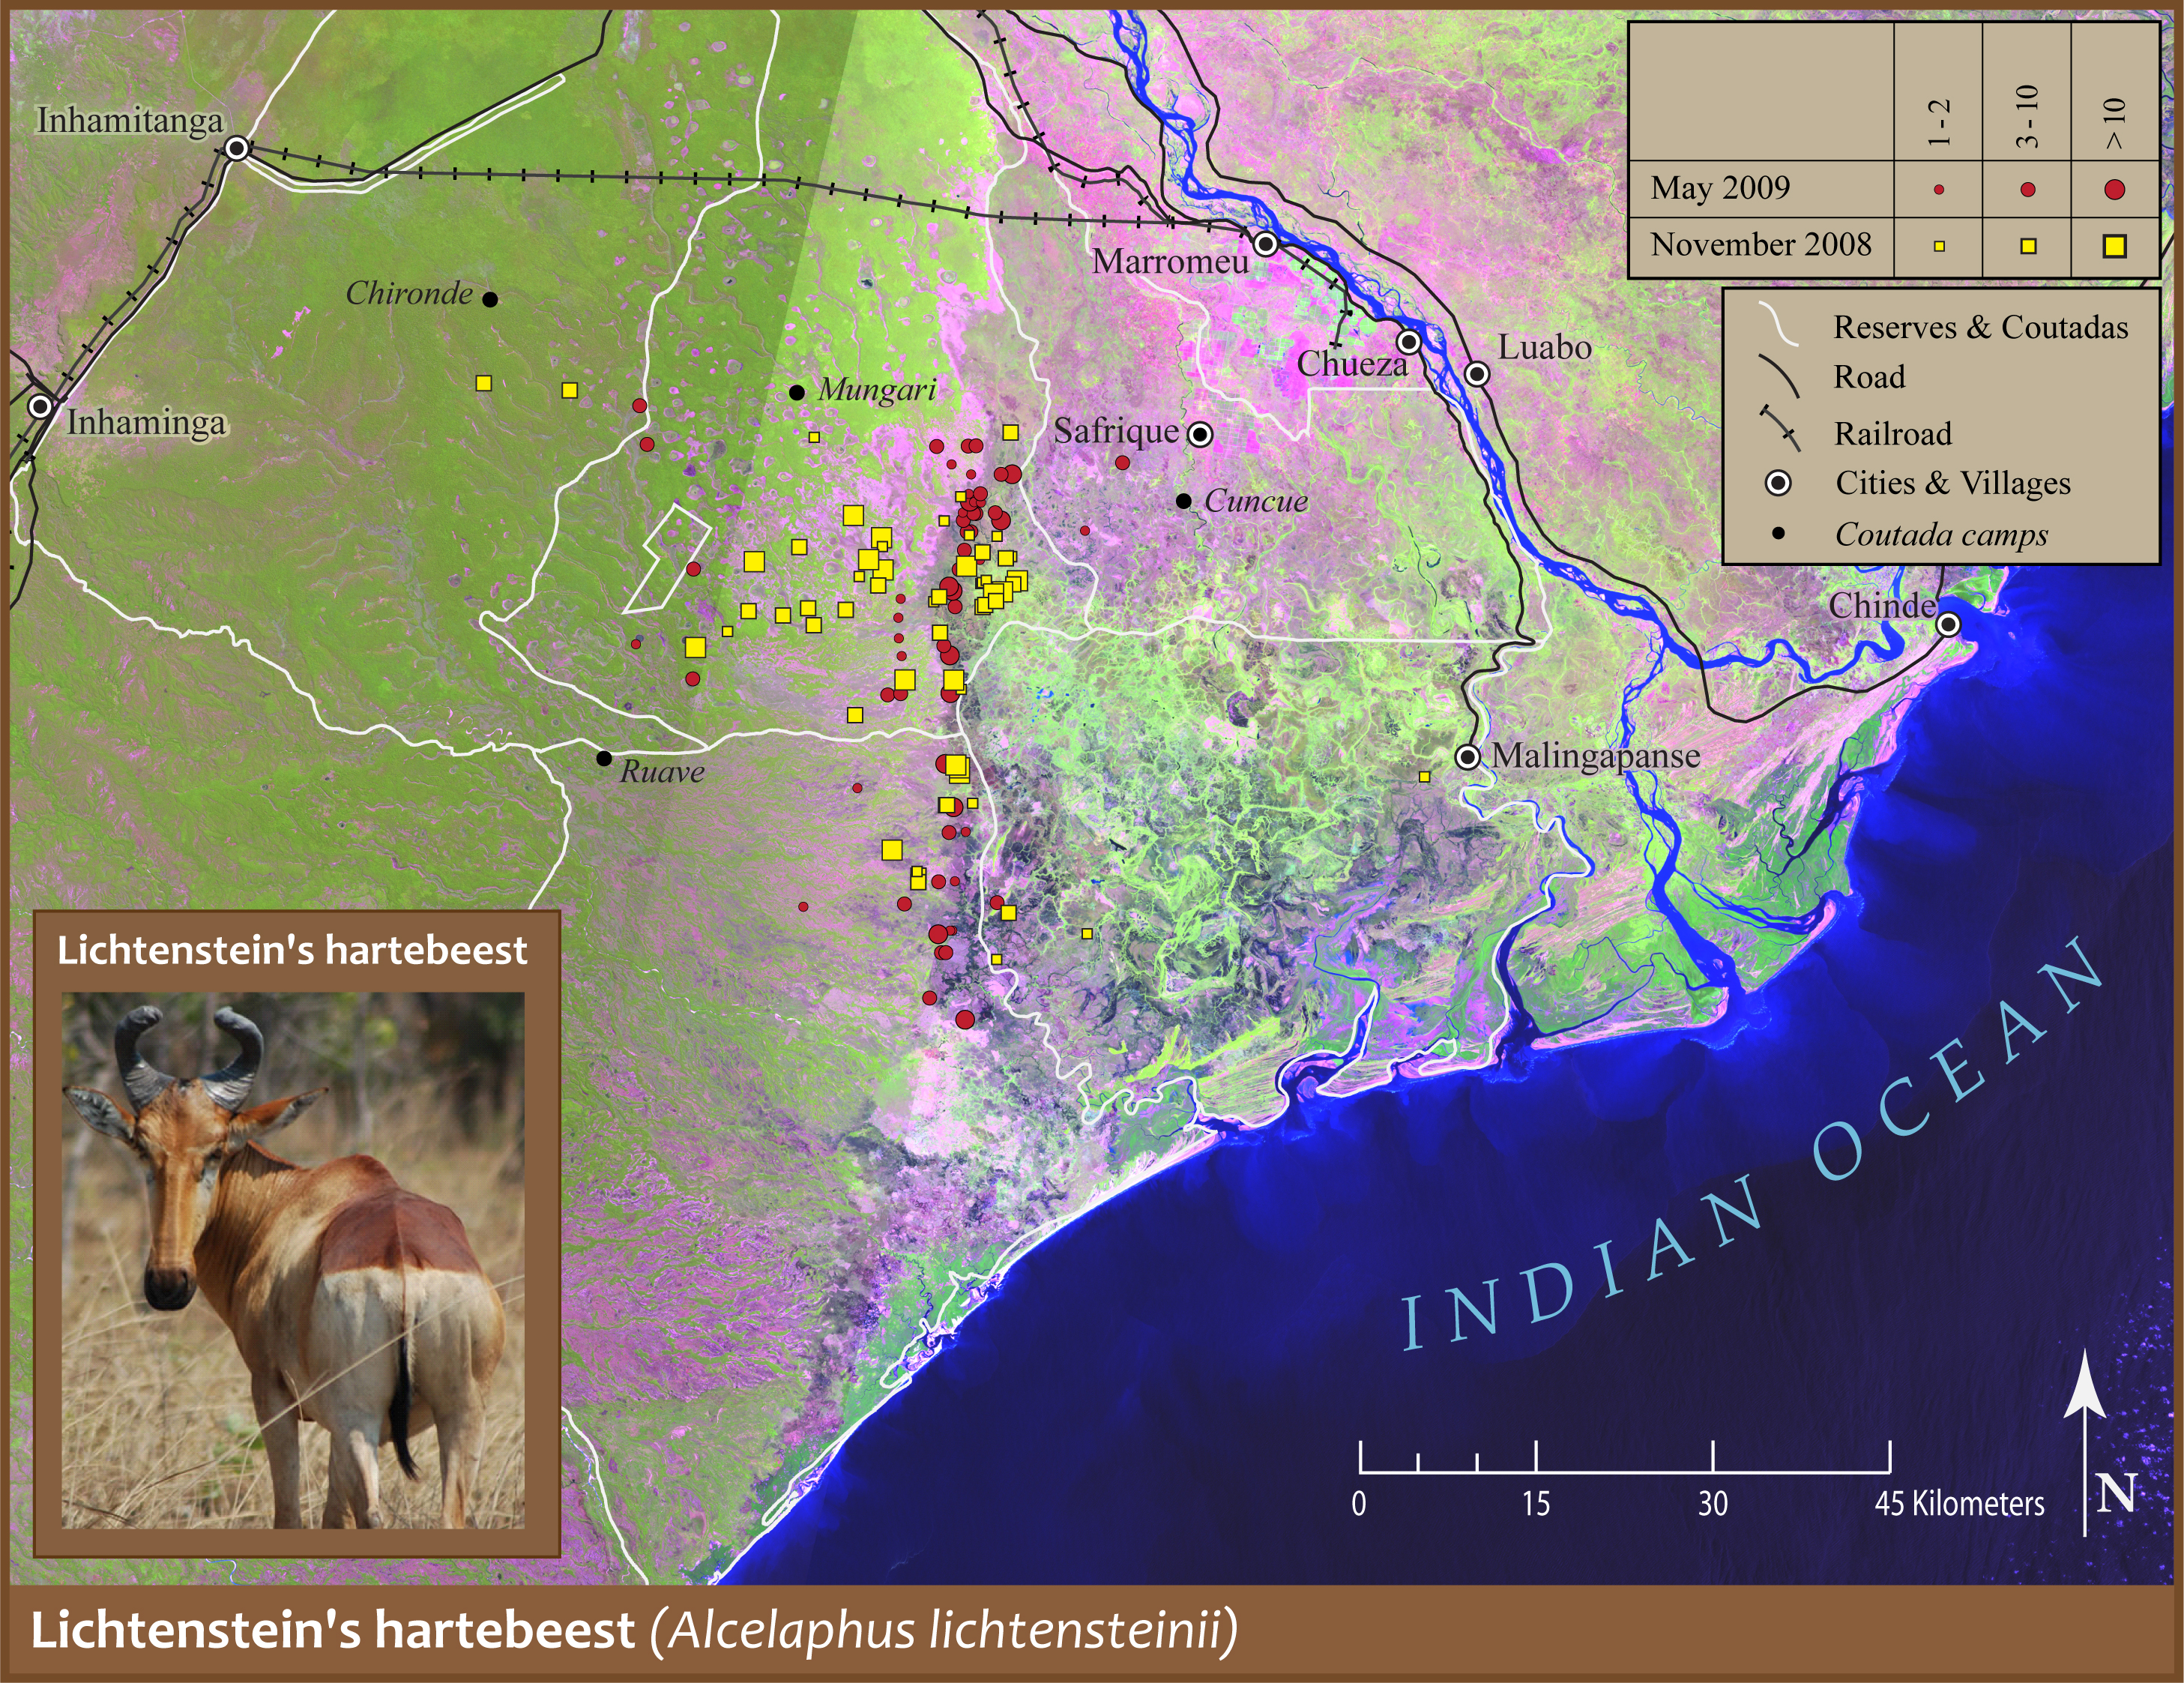
Example map from a series illustrating changes in sightings of wildlife during aerial surveys of areas in and around Gorongoza National Park, Mozambique in the early 2000s. The maps were used in reports and slide presentations by the researchers to highlight the success and challenges of conservation efforts in the region.
Tools: ArcMap, Adobe Illustrator, Avenza MAPublisher